A linear regression line is of the form w1x+w2=y and it is the line that minimizes the sum of the squares of the distance from each data point to the line. So, given n pairs of data (xi, yi), the parameters that we are looking for are w1 and w2 which minimize the error
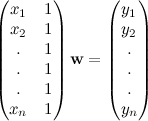
and we can compute the parameter vector w = (w1 , w2)T as the least-squares solution of the following over-determined system
Let's use numpy to compute the regression line:
from numpy import arange,array,ones,linalg
from pylab import plot,show

xi = arange(0,9)
A = array([ xi, ones(9)])
# linearly generated sequence
y = [19, 20, 20.5, 21.5, 22, 23, 23, 25.5, 24]
w = linalg.lstsq(A.T,y)[0] # obtaining the parameters

# plotting the line
line = w[0]*xi+w[1] # regression line
plot(xi,line,'r-',xi,y,'o')
show()
We can see the result in the plot below.

You can find more about data fitting using numpy in the following posts: Update, the same result could be achieve using the function scipy.stats.linregress (thanks ianalis!):
from numpy import arange,array,ones#,random,linalg
from pylab import plot,show
from scipy import stats

xi = arange(0,9)
A = array([ xi, ones(9)])
# linearly generated sequence
y = [19, 20, 20.5, 21.5, 22, 23, 23, 25.5, 24]

slope, intercept, r_value, p_value, std_err = stats.linregress(xi,y)

print 'r value', r_value
print  'p_value', p_value
print 'standard deviation', std_err

line = slope*xi+intercept
plot(xi,line,'r-',xi,y,'o')
show()
Possible Bugs: x_lst is unused and w[] is undefined?
ReplyDeleteThanks Steve, I fixed it. I changed the code at the end to make it consisted with the notation.
ReplyDeleteAnother method is to use scipy.stats.linregress()
ReplyDeleteIn the particular case when y=w1*x+w2 you can use both linregress and lstsq as shown above.
DeleteWhen you want to regress to multiple x-s, e.g.
y=w1*x1+w2*x2+w3*x3 you need to use lstsq.
What is the r_value and the p_value in the second program? What do they represent?
ReplyDeleter_value is the correlation coefficient and p_value is the p-value for a hypothesis test whose null hypothesis is that the slope is zero.
ReplyDeleteFor more information about correlation you can fin my last post:
http://glowingpython.blogspot.com/2012/10/visualizing-correlation-matrices.html
And you can find more about p-value here:
http://en.wikipedia.org/wiki/P-value
how can i get the sum squared error of the regression from this function ??
ReplyDeleteYou can compute the mean square error as follows:
Deleteerr=sqrt(sum((line-xi)**2)/n)
thank you, and what's n in this case? the number of rows in the 2D list ??
Deleten is the number of samples that you have: n = len(y).
DeleteBtw, there's a mistake in my last comment, the squared error is err=sqrt(sum((line-y)**2)/n)
Is there a way to calculate the maximum and minimum gradient, given multiple pairs of (x,y) measurements at each point e.g. repeated trials? Thanks!!
ReplyDeleteThe following function is quite nice: scipy.stats.linregress
ReplyDeletehttp://docs.scipy.org/doc/scipy/reference/generated/scipy.stats.linregress.html
It provides the p-value and r-value without extra work.
Awesome! just what I was looking for.
ReplyDeleteThis comment has been removed by the author.
ReplyDeleteI stumbled upon this fine piece of work, and it seemed to work just fine.
ReplyDeleteI although came across a problem, once the slope (from the updated code) turned either negative or below zero which meant that the "line" list became empty. To solve this, I simply did the following instead which solved my issue:
line = A[0]+intercept
Update:
DeleteWhile the data now provided is correct, I ran into yet another issue. When I tried to plot the line for a negative coefficient, it didn't plot the slope as going downwards, but rather upwards. I couldn't get to solve the issue so instead, I ended up using the following library:
coefficients = np.polyfit(xi, y, 1)
polynomial = np.poly1d(coefficients)
ys = polynomial(xi)
plot(xi, ys, 'r-', xi, y, 'o')
show()
Source:
http://sdtidbits.blogspot.dk/2009/03/curve-fitting-and-plotting-in-python.html
* Note that this requires that you: import numpy as np
I will investigate this issue further and hopefully find away around this issue as I like the extra variables which the original code from this blog post provides. Until then, I will use the two libraries together to avoid any further issues, as I am still interested in the "r"- and "p"-values as well the standard error.
Alright, so I finally managed to find a solution which combines the best of both worlds basically hassle-free. The approach is basically the same as from the updated original code:
Deleteslope, intercept, r_value, p_value, std_err = stats.linregress(xi,y)
Instead of calculating the "line", I managed to solve my issues as explained above doing the following:
polynomial = np.poly1d([slope, intercept])
line = polynomial(xi)
plot(xi, line, 'r-', xi, y, 'o')
show()
And there you have it; a solution which also works when the coefficient is below 1! This also means, that you no longer have to use the "A" matrix as implemented in the original code; which doesn't seem to be used anyhow.
Thanks for the great work, to the original author!
Hi David, at the moment I'm using the implementation provided by sklearn, maybe you could find it helpful: http://scikit-learn.org/stable/auto_examples/linear_model/plot_ols.html#example-linear-model-plot-ols-py
ReplyDeleteThis comment has been removed by a blog administrator.
ReplyDeleteHow about a 2D linear regression ? Can you please suggest whats the easiest way to perform the same analysis on a 2D dataset ?
ReplyDeleteHi Adviser, you could try the linear regression module provided by sklearn. You can find the link some comments above.
DeleteIs there an easy way to plot a regression line that would be based only part of the y data. For example plot the whole y but plot regression line only for:
ReplyDelete[20.5, 21.5, 22, 23, 23, 25.5, 24]
It should be very simple, you create your shorter version of y and you apply the regression to this data. Then, you plot the regression line and the the points of the original data as showed in the post.
Deletestd_err is not standard deviation, but the error of the estimated slope!
ReplyDeleteIs it necessary to add "ones(9)"? I usually have just the independent variable x, and the dependent one y,... I don't know how, why and when should I add ones column to my independent var (x). regards
ReplyDeleteJust one more,... how to predict the new data set with my new set of points? Y use Xtrain and Y train, the model W=inv(Xtrain.T*Xtrain)*Xtrain.T*Ytrain , with np.dot, of course... so when predicting y use Ypred = Xvalid*W, ... but it's not working to me :(
ReplyDeleteHi Javier, given your two questions I'd recommend you to check http://scikit-learn.org/stable/modules/generated/sklearn.linear_model.LinearRegression.html
DeleteThis takes care of the "ones" and the prediction for you.