where cov(X,Y) is the covariance between X and Y, while σX and σY are the standard deviations. If N is number of variables then R is a N-by-N matrix. Then, when we have a large number of variables we need a way to visualize R. The following snippet uses a pseudocolor plot to visualize R:
from numpy import corrcoef, sum, log, arange
from numpy.random import rand
from pylab import pcolor, show, colorbar, xticks, yticks

# generating some uncorrelated data
data = rand(10,100) # each row of represents a variable

# creating correlation between the variables
# variable 2 is correlated with all the other variables
data[2,:] = sum(data,0)
# variable 4 is correlated with variable 8
data[4,:] = log(data[8,:])*0.5

# plotting the correlation matrix
R = corrcoef(data)
pcolor(R)
colorbar()
yticks(arange(0.5,10.5),range(0,10))
xticks(arange(0.5,10.5),range(0,10))
show()
The result should be as follows:
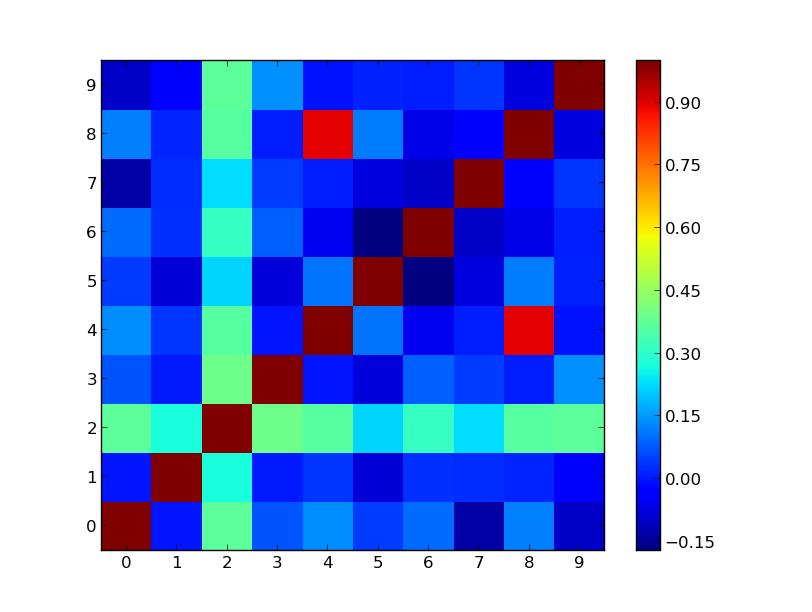
As we expected, the correlation coefficients for the variable 2 are higher than the others and we observe a strong correlation between the variables 4 and 8.