Monday, March 18, 2013

Binary Plots

A binary plot of an integer sequence is a plot of the binary representations of successive terms where each term is represented as a sequence of bits with 1s colored black and 0s colored white. Then each representation is stacked to form a table where each entry represents a bit in the sequence.
To make a binary plot of a sequence we need to convert each term of the sequence into its binary representation. Then we have to put this representation in a form which make us able to build the plot easily. The following function converts the sequence in a matrix where the element i-j represents is the bit j of the element i of the sequence:
from numpy import zeros,uint8
from pylab import imshow,subplot,show

def seq_to_bitmatrix(s):
 """ Returns a matrix where the row i 
     is the binary representation of s[i] 
     s must be a list of integers (also long) """
 # maximum number of bits used in this sequence
 maxbit = len(bin(max(s)))
 M = zeros((len(s),maxbit),dtype=uint8)
 for i,e in enumerate(s):
  bits = bin(e)[2:] # bin() -> 0b100, we drop 2 chars
  for j,b in enumerate(bits):
   M[i,maxbit-len(bits)+j] = int(b) # fill the matrix
 return M       
The matrix returned by the function above represent each bit with an integer. Of course, this is a waste of space but makes us able to use the function imshow in order to draw the binary plot:
def show_binary_matrix(M):
 imshow(M,cmap='Greys', interpolation='nearest')
 show()
Now we have all the necessary. Let's plot the factorial sequence:
from math import factorial
s = [factorial(n) for n in range(200)]
show_binary_matrix(seq_to_bitmatrix(s))
The following graph shows the result:


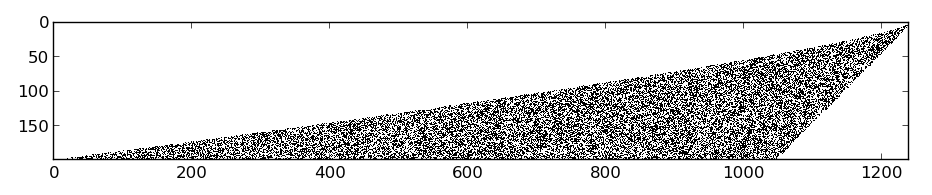
From this graph we can observe two interesting things. The first is that we need more than 1200 bits to represent the biggest number of the sequence we generated, which is 199!, and the second is that when n grows the bits on the right tend to be unused.
Let's see what happen with the famous Fibonacci sequence:
fib_cache = {0:0,1:1}
def fib_memo(n):
 """ Returns the first n Fibonacci numbers """
 if n not in fib_cache:
  fib_cache[n] = fib_memo(n-1)+fib_memo(n-2)
 return fib_cache[n]

s = [fib_memo(n) for n in range(1,150)]
show_binary_matrix(seq_to_bitmatrix(s))
In the snippet above we compute the first 149 Fibonacci numbers using memoization then we plotted the sequence in the same way of the factorial. This time the result is surprising:


Indeed, it is very interesting to observe that the graph reveals a fractal like pattern of hollow and filled triangles.
Another sequence that shows a fractal like series of patter is the sum of the first n natural numbers which we can plot as follows:
s = [n*(n+1)/2 for n in range(124)]
show_binary_matrix(seq_to_bitmatrix(s).T)
In this case the Gauss formula have been used to compute the terms of the sequence and this is the result:


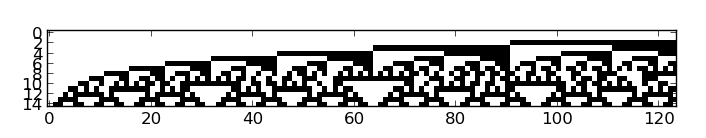
This time the matrix have been transposed to have a vertical visualization. We have that each column is a binary representation of a term of the sequence. In conclusion, we plot the sequence np for p = 1,2,3,4:
# n^p
for p in range(1,5):
    s = [pow(n,p) for n in range(124)]
    subplot(4,1,p)
    imshow(seq_to_bitmatrix(s).T,cmap='Greys',  interpolation='nearest')
show()
And we have this:


We can see that for p=1,2 we have something that looks like the graph we obtained with the sequence of the sum of the first n natural numbers.

Thursday, March 7, 2013

Insertion Sort animation

To continue the series of animated sorting algorithm this time we will deal with the Insertion Sort. We are still in the basic algorithms and the way it works is pretty simple. It inserts each element of the array into its proper position, leaving progressively larger stretches of the array sorted. What this means in practice is that the sort iterates down an array, and the part of the array already covered is in order; then, the current element of the array is inserted into the proper position at the head of the array while the rest of the elements are moved using the space just vacated by the element inserted. The Python snippet for creating the animation is the following:
def insertionsort_anim(a):
 x = range(len(a))
 for i in range(1,len(a)):
  val = a[i]
  j = i-1
  while j >= 0 and a[j] > val:
   a[j+1] = a[j] # creating the space for the insertion
   j = j-1
  a[j+1] = val # insertion
  pylab.plot(x,a,'k.',markersize=6)
  pylab.savefig("insertionsort/img" + '%04d' % i + ".png")
  pylab.clf()

# running the algorithm
a = range(300)
shuffle(a)
insertionsort_anim(a)
The strategy used to create the video is the usual and we can see the result in the following video:

It's interesting to see that the algorithm forms small subsets of sorted items that tend to join when the number of iteration grows and the holes between the them are filled by the insertion process.

Saturday, March 2, 2013

Bubble Sort visualized

The bubble sort algorithm is one of the simplest sorting methods to implement and in this post we will see that it is also one of the best to visualize. It works by repeatedly exchanging adjacent elements when necessary and stops when no exchanges are required. Thus, smaller elements will "bubble" to the front, (or bigger elements will be "bubbled" to the back). The following snippet is able to visualize the behavior of the bubble sort:
import pylab
from random import shuffle

def bubblesort_anim(a):
 x = range(len(a))
 imgidx = 0
 # bubble sort algorithm
 swapped = True
 while swapped: # until there's no swapping
  swapped = False
  for i in range(len(a)-1):
   if a[i] > a[i+1]:
    a[i+1], a[i] = a[i], a[i+1] # swap
    swapped = True
  pylab.plot(x,a,'k.',markersize=6)
  pylab.savefig("bubblesort/img" + '%04d' % imgidx + ".png")
  pylab.clf() # figure clear
  imgidx = imgidx + 1

# running the algorithm
a = range(300)
shuffle(a)
bubblesort_anim(a)
The snipped is based same technique we have seen to visualize the insertion sort algorithm and to build the animation. At each iteration an image that represents the status of the array is saved to the disk and ffmpeg is used to build a video as showed in the last post. This time the result should be as follows:

The animation is easy on the eyes and we can observe that during the sorting process the smallest elements approach to their correct positions as the bubbles go up in a glass of soda.

Stay tuned to see the animation of the insertion sort algorithm!