def oddeven_anim(a):
 imgidx = 0
 x = range(len(a))
 sort = False;
 while not sort:
  sort = True;
  for i in range(1,len(a)-1,2): # odd phase
   if a[i] > a[i+1]:
    a[i+1], a[i] = a[i], a[i+1]
    sort = False;
  for i in range(0,len(a)-1,2): # even phase
   if a[i] > a[i+1]:
    a[i+1], a[i] = a[i], a[i+1]
    sort = False;
  pylab.plot(x,a,'k.',markersize=6)
  pylab.savefig("oddevensort/img" + '%04d' % imgidx + ".png")
  pylab.clf()
  imgidx =  imgidx + 1

# run the algorithm
a = range(300)
shuffle(a)
oddeven_anim(a)
As in the other examples of sorting visualization in this blog, we have an image for each step of the algorithm. The following video have been produced joining all the images (here is explained how):A collection of sloppy snippets for scientific computing and data visualization in Python.
Thursday, April 11, 2013
Odd-Even sort visualized
The Odd/Even sort is a sorting algorithm which uses the concept of the Bubble Sort to move elements around. Unlike Bubble sort, the Odd/Even sort compares disjointed pairs by using alternating odd and even index values splitting the sorting in different phases. We have that in the odd phase all the element with an odd index i are compared with the adjacent even index i+1 and in the even phase all the element with an even index i are compared with the adjacent odd index i+1. These two phases are repeated until no exchanges are required. This is a Python snippet that make us able to visualize the behavior of the algorithm:
Monday, April 1, 2013
Real-time Twitter analysis
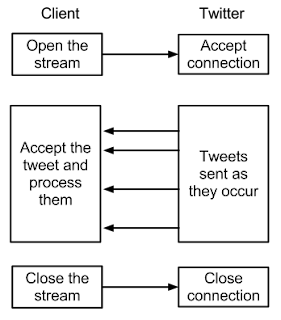
The twitter API is a great tool for analyze tweets by code. In particular, the streaming API gives real time access to the global stream of tweets and, unlike a conventional REST API, it is used through a continuous connection to the Twitter servers. So it requires a persistent HTTP connection open as long as you need to collect tweets. The typical workflow of an application which uses this API is the following:
The easiest way to handle an HTTP streaming in Python is to use PyCurl, the Python bindings for the famous Curl network library. PyCurl allows you to provide a callback function that will be executed every time a new block of data is available. The following code is a simple demonstration of how we can use HTTP streaming with PyCurl in order to analyzie a stream of tweet:
In the method begin, we use the PyCurl library for the authentication to Twitter and start the connection. In particular, we set that the method on_receive is the callback function demanded to processing of the incoming. In this method the actual analysis is done, every tweet is split in tokens and a part of speech tagging is performed. Then, the frequency of all the words that are adjective or nouns is updated.
The method print_stats is used to print the our statistics on the console while close_and_plot plots an histogram using the frequencies in the dictionary and closes the program.
Let's use this class:
This code starts a program which analyzes all the tweet of the New York Area in real time and prints the statistics every 50 tweets, just like follows:

We see that is very common to post a link in a tweet (turned out that http is considered as a noun most of the time) and that the words day, today, good and morning were the most used during the analysis.

The easiest way to handle an HTTP streaming in Python is to use PyCurl, the Python bindings for the famous Curl network library. PyCurl allows you to provide a callback function that will be executed every time a new block of data is available. The following code is a simple demonstration of how we can use HTTP streaming with PyCurl in order to analyzie a stream of tweet:
from __future__ import division
from collections import defaultdict
from pylab import barh,show,yticks
import pycurl
import simplejson
import sys
import nltk
import re

def plot_histogram(freq, mean):
 # using dict comprehensions to remove not frequent words
 topwords = {word : count
             for word,count in freq.items()
             if count > round(2*mean)}
 # plotting
 y = topwords.values()
 x = range(len(y))
 labels = topwords.keys()
 barh(x,y,align='center')
 yticks(x,labels)
 show()

class TwitterAnalyzer:
 def __init__(self):
  self.freq = defaultdict(int)
  self.cnt = 0
  self.mean = 0.0
  # composing the twitter stream url
  nyc_area = 'locations=-74,40,-73,41'
  self.url = "https://stream.twitter.com/1.1/statuses/filter.json?"+nyc_area

 def begin(self,usr,pws):
  """
    init and start the connection with twitter using pycurl
    usr and pws must be valid twitter credentials
  """
  self.conn = pycurl.Curl()
  # we use the basic authentication,
  # in future oauth2 could be required
  self.conn.setopt(pycurl.USERPWD, "%s:%s" % (usr, pws))
  self.conn.setopt(pycurl.URL, self.url)
  self.conn.setopt(pycurl.WRITEFUNCTION, self.on_receive)
  self.conn.perform()

 def on_receive(self,data):
  """ Handles the arrive of a single tweet """
  self.cnt += 1
  tweet = simplejson.loads(data)
  # a little bit of natural language processing
  tokens = nltk.word_tokenize(tweet['text']) # tokenize
  tagged_sent = nltk.pos_tag(tokens) # Part Of Speech tagging
  for word,tag in tagged_sent:
   # filter sigle chars words and symbols
   if len(word) > 1 and re.match('[A-Za-z0-9 ]+',word):
    # consider only adjectives and nouns
    if tag == 'JJ' or tag == 'NN':
     self.freq[word] += 1 # keep the count
  # print the statistics every 50 tweets
  if self.cnt % 50 == 0:
   self.print_stats()

 def print_stats(self):
  maxc = 0
  sumc = 0
  for word,count in self.freq.items():
   if maxc < count:
    maxc = count
   sumc += count
  self.mean = sumc/len(self.freq)
  print '-------------------------------'
  print ' tweets analyzed:', self.cnt
  print ' words extracted:', len(self.freq)
  print '   max frequency:', maxc
  print '  mean frequency:', self.mean

 def close_and_plot(self,signal,frame):
  print ' Plotting...'
  plot_histogram(self.freq,self.mean)
  sys.exit(0)
In the constructor of this class we initialize a dictionary that will contain the frequency of each word, a string that contains the url of the service we need to call (composed in order to query twitter for the tweets in NYC) and the variables cnt and mean to keep track of the number of tweets analyzed and of the mean frequency over all the words.In the method begin, we use the PyCurl library for the authentication to Twitter and start the connection. In particular, we set that the method on_receive is the callback function demanded to processing of the incoming. In this method the actual analysis is done, every tweet is split in tokens and a part of speech tagging is performed. Then, the frequency of all the words that are adjective or nouns is updated.
The method print_stats is used to print the our statistics on the console while close_and_plot plots an histogram using the frequencies in the dictionary and closes the program.
Let's use this class:
import signal
usr = 'supersexytwitteruser'
pws = "yessosexyiam"

ta = TwitterAnalyzer()
# invoke the close_and_plot() method when a Ctrl-D arrives
signal.signal(signal.SIGINT, ta.close_and_plot)
ta.begin(usr,pws) # run the analysis
In the code above, a TwitterAnalyzer object is instantiated, its method close_and_plot is registered as handler for the SIGINT signal and, finally, begin is invoked.
This code starts a program which analyzes all the tweet of the New York Area in real time and prints the statistics every 50 tweets, just like follows:
-------------------------------
 tweets analyzed: 50
 words extracted: 110
   max frequency: 8
  mean frequency: 1.12727272727
-------------------------------
 tweets analyzed: 100
 words extracted: 200
   max frequency: 22
  mean frequency: 1.235
-------------------------------
 tweets analyzed: 150
 words extracted: 286
   max frequency: 29
  mean frequency: 1.26573426573
-------------------------------
 tweets analyzed: 200
 words extracted: 407
   max frequency: 39
  mean frequency: 1.31203931204
-------------------------------
 tweets analyzed: 250
 words extracted: 495
   max frequency: 49
  mean frequency: 1.37575757576
Pressing Cntrl-D we can stop the program and plot a bar chart of adjectives and nouns detected. This is what I got in the morning of March 21, 2013:

We see that is very common to post a link in a tweet (turned out that http is considered as a noun most of the time) and that the words day, today, good and morning were the most used during the analysis.
Subscribe to:
Posts (Atom)